
The car you choose can reshape your insurance costs.
How Vehicle Type Affects Your Insurance Quote and What You’ll Pay

Content
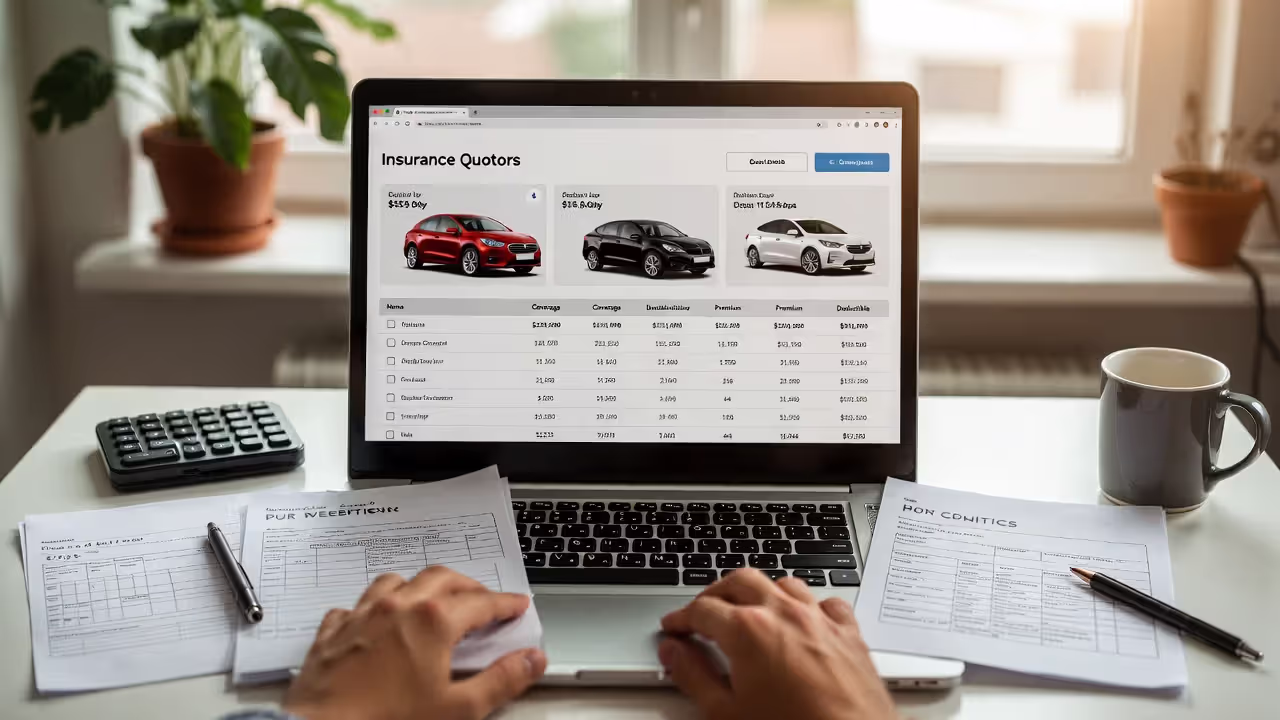
Request an auto insurance quote for a Honda Accord, and you might see $1,200 per year. Switch to a Dodge Charger—keeping everything else identical—and watch that number jump to $2,400. Same person, same driving record, same coverage limits. The only difference? The car itself.
Your vehicle choice creates ripple effects through your insurance budget that most buyers don't anticipate until they're already committed. Here's what actually happens behind the scenes when insurers calculate your premium.
Why Insurers Price Different Vehicles Differently
Insurance companies build their pricing on mountains of historical data, not gut feelings about which cars look fast. Every model generates its own claims profile over time: collision frequency, damage severity, theft incidents, bodily injury payouts, and repair bills. Actuaries transform this information into risk classifications that become your premium.
The Insurance Institute for Highway Safety tracks collision patterns and claim costs down to specific trim levels. When actuaries spot a pattern—say, a particular model consistently appears in expensive claims involving multiple vehicles, or gets stolen three times more often than average—premiums adjust accordingly. Cars with minimal claims history, strong safety performance, and reasonable repair costs move in the opposite direction.
"Vehicle rating is fundamentally about predicting future losses based on past performance. A sports car with 400 horsepower and a theft rate three times the national average will always command higher premiums than a family sedan with advanced safety features and minimal theft risk."
— Robert Hunter, Director of Insurance, Consumer Federation of America
Beyond raw statistics, insurers notice behavioral patterns tied to vehicle categories. Sports car owners accumulate speeding tickets at higher rates. Minivan drivers file fewer at-fault claims. While companies can't legally price based on stereotypes, the actual claims data validates these correlations. Someone driving a Subaru Outback statistically costs insurers less than a Mustang GT owner, and your quote reflects that mathematical reality.
Sports Cars vs. Sedans: The Premium Gap Explained
First-time performance car buyers routinely experience sticker shock when they see their insurance quote. The spread between high-performance vehicles and regular sedans runs anywhere from 30% on the low end to double or more. Take a 25-year-old driver: a Toyota Camry might run $1,800 yearly, while a Chevrolet Corvette with the exact same coverage and deductible structure could hit $3,600 or climb even higher.
What Qualifies as a "Sports Car" to Insurance Companies

Author: Tara Livingston;
Source: trialstribulations.net
No industry-wide definition exists, but certain vehicle characteristics consistently trigger performance-vehicle pricing:
Horsepower and engine configuration drive the classification. Cross the 300-horsepower threshold, add a turbocharger, or install a V8, and you've entered premium territory. Compare the standard Honda Civic with the Type R variant—same basic architecture, but that turbocharged engine pushes it into an entirely different insurance bracket.
Two doors typically cost more than four. Coupes and convertibles draw additional scrutiny. The Mazda MX-5 Miata produces modest horsepower compared to true muscle cars, yet costs substantially more to insure than a Mazda3 sedan because insurers classify it as a performance roadster.
Trim packages create dramatic price swings within the same model. A base Ford Mustang with the standard V6 might add 20% to your premium versus a Ford Fusion. Step up to the Mustang GT and its V8 engine? That gap widens to 60% or beyond. The Shelby GT500 pushes costs even higher thanks to extreme performance specifications.
Luxury sport sedans occupy middle ground. BMW's 3 Series costs more than a Toyota Camry but considerably less than a Porsche 911. Higher repair expenses and performance capability push rates up, while four doors and comprehensive safety technology pull them back down.
Typical Rate Differences You Can Expect
Looking at 2023 national averages reveals the actual dollar impact:
- Standard sedan (Honda Accord, Toyota Camry): $1,400–$1,800 yearly
- Entry sports car (Mazda MX-5, Subaru BRZ): $1,800–$2,400 yearly
- Muscle car (Dodge Charger R/T, Ford Mustang GT): $2,200–$3,000 yearly
- High-performance sports car (Chevrolet Corvette, Porsche 911): $3,000–$5,000+ yearly
These numbers assume you're 35 with a spotless driving history and full coverage including collision and comprehensive. Younger drivers? The numbers get ugly fast—some 20-year-olds pay $6,000 or more annually for performance vehicles.
The quote impact of vehicle type extends past your base liability premium. Comprehensive and collision coverage scale directly with repair complexity and theft probability. A parking lot fender-bender might require $2,000 in repairs on a Camry but $4,500 on a BMW M3 because of specialized components and higher labor rates.
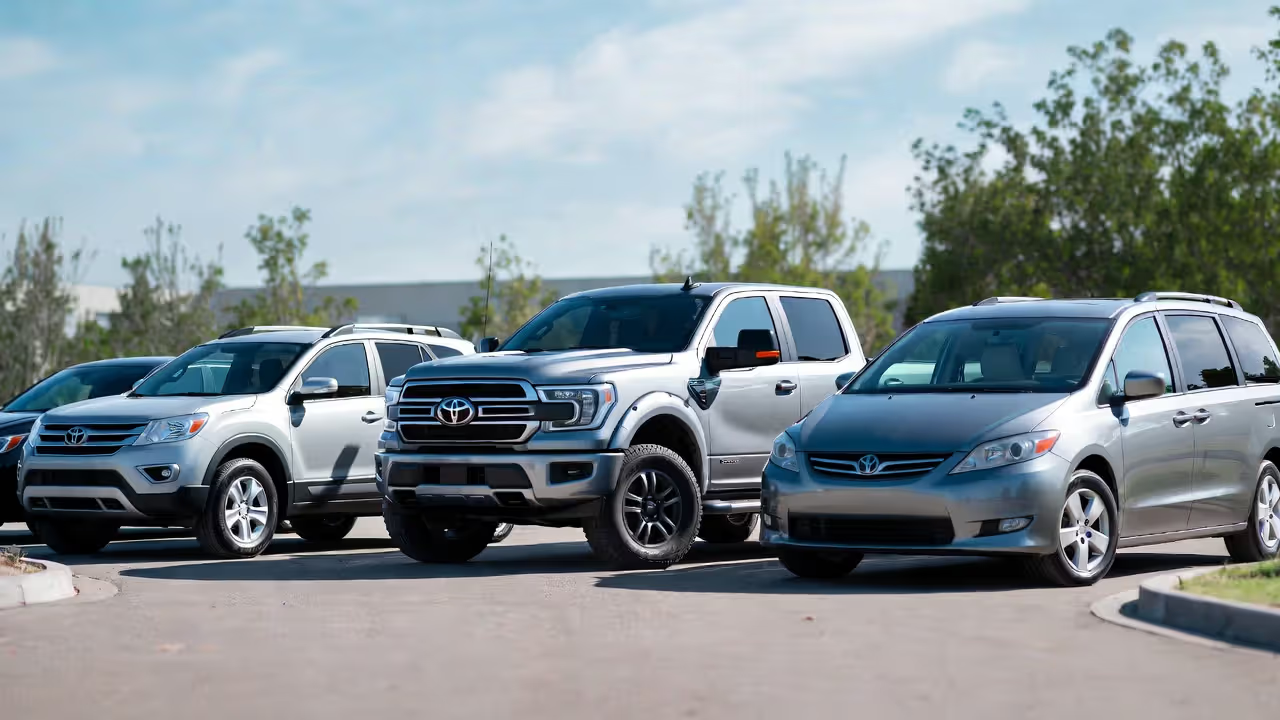
SUVs, Trucks, and Minivans: How Family Vehicles Stack Up
Common sense suggests bigger vehicles mean bigger premiums, but SUV vs sedan rates don't follow that logic. Mid-size SUVs frequently cost less than sports sedans and sometimes even undercut standard sedan premiums. A Honda CR-V typically runs 5-15% cheaper to insure than a Honda Accord, despite extra size and weight.
Several counterintuitive factors explain this pattern:
Author: Tara Livingston;
Source: trialstribulations.net
SUVs protect occupants better during collisions. Higher seating position combined with additional mass provides superior crash protection, especially when colliding with smaller cars. The Insurance Institute for Highway Safety consistently awards SUVs top marks, translating to fewer severe injury claims and reduced medical payouts.
Family-focused vehicles attract statistically safer drivers. Actuarial data reveals minivan and SUV owners file fewer at-fault claims than sports sedan drivers. Insurers can't explicitly price on driver demographics, but the correlation between vehicle selection and actual claims experience influences loss ratios across these categories.
Mainstream SUV theft rates remain unremarkable. Full-size trucks like the Ford F-150 dominate theft statistics, but compact and mid-size SUVs experience average theft frequency. The Subaru Outback and Honda CR-V don't attract the same criminal attention as luxury sedans or high-performance cars.
Luxury SUVs shatter this pattern completely. A Range Rover costs dramatically more than a Toyota RAV4 because of expensive repairs, elevated theft risk, and high replacement value. Performance SUVs like the Jeep Grand Cherokee Trackhawk or Porsche Cayenne Turbo command sports-car premiums despite their size.
Full-size trucks create their own category. A Ford F-250 Super Duty costs more than a compact sedan but often less than sports cars. High theft rates increase comprehensive coverage costs, yet strong safety ratings and moderate collision frequency keep liability premiums manageable.
Four Cost Factors That Drive Vehicle-Based Pricing
Insurers analyze every vehicle model across multiple risk dimensions. Understanding these elements helps you predict insurance costs before signing purchase paperwork.
Author: Tara Livingston;
Source: trialstribulations.net
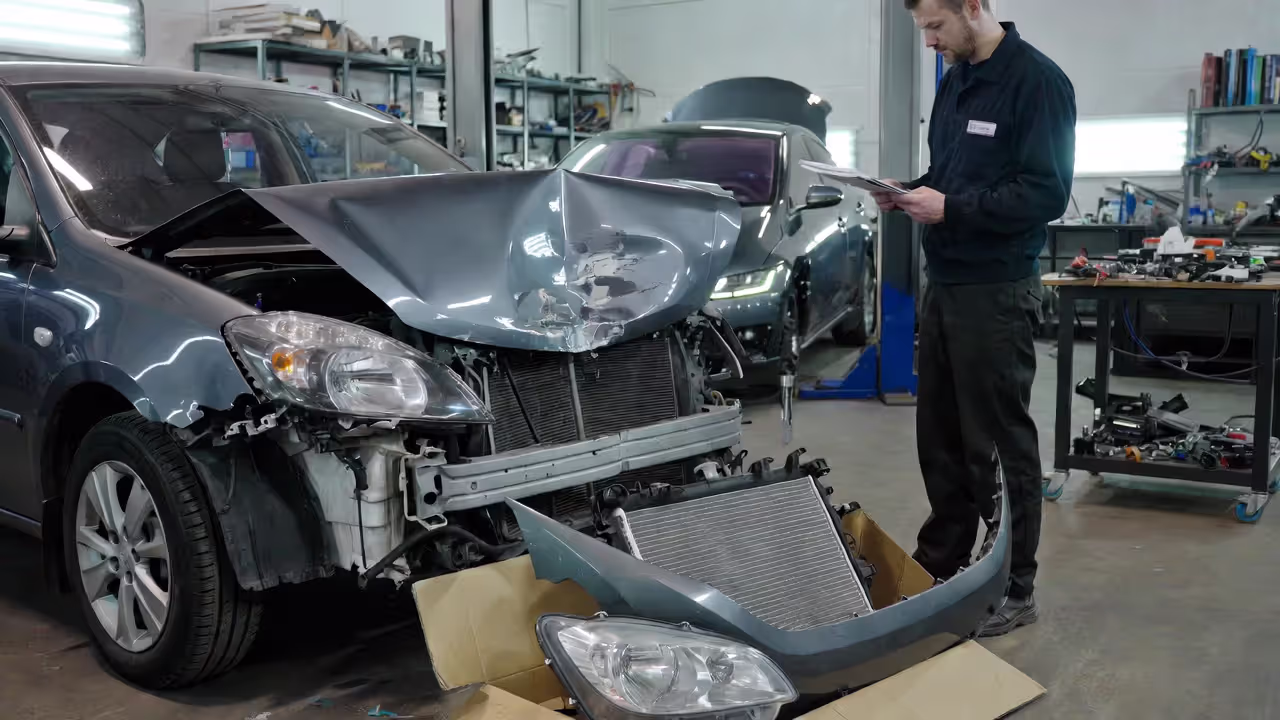
Repair and Replacement Part Costs
Labor rates and parts availability directly determine collision and comprehensive premiums. Repair cost factors explain why two vehicles with similar sticker prices carry wildly different insurance quotes.
European luxury brands typically run 40-60% more expensive to repair than Japanese or domestic equivalents. A Mercedes-Benz C-Class demands specialized technicians, costly OEM components, and extended repair timelines compared to a Toyota Camry. Even simple fixes like replacing a side mirror cost $400-$600 on luxury models versus $150-$250 on mainstream vehicles.
Aluminum body construction substantially increases repair expenses. The Ford F-150's aluminum panels require specialized welding equipment and certified training, making collision repairs pricier than traditional steel-bodied trucks. Insurers incorporate these elevated costs when calculating premiums.
Parts availability affects total-loss decisions and repair duration. Vehicles with abundant aftermarket parts cost less to restore. Exotic or limited-production models may wait weeks for parts delivery, increasing rental car expenses and overall claim costs.
Theft Risk and Recovery Rates
Theft risk pricing reflects both how often specific models get stolen and whether they typically get recovered. The National Insurance Crime Bureau publishes annual most-stolen vehicle lists, and insurers adjust comprehensive coverage pricing based on where your model ranks.
Full-size pickups dominate theft statistics year after year. The Ford F-Series, Chevrolet Silverado, and Ram pickup consistently top theft charts. Criminals target these trucks for parts resale, international export, or use in other crimes. Comprehensive coverage for these models costs 20-30% more than comparable vehicles with minimal theft risk.
Luxury vehicles face elevated theft probability but often include sophisticated anti-theft technology. A BMW equipped with factory alarm, GPS tracking, and remote shutdown capability gets stolen less frequently than older models lacking these protections. Insurers recognize these distinctions when calculating theft risk pricing.
Recovery rates matter as much as theft frequency. Vehicles stolen for joyriding often reappear damaged but salvageable. Cars stolen for parts stripping or overseas export rarely return, resulting in total-loss claims. Models with high theft rates and low recovery percentages carry the steepest comprehensive premiums.
Safety Ratings and Crash Test Performance
Safety rating impact on premiums varies between insurers but typically creates 5-20% spreads between top-rated and poorly-rated vehicles. The Insurance Institute for Highway Safety and National Highway Traffic Safety Administration conduct standardized crash testing, providing objective safety metrics insurers incorporate into pricing algorithms.
Vehicles earning IIHS Top Safety Pick awards demonstrate exceptional crashworthiness and collision-avoidance technology. These models better protect occupants during accidents, reducing injury severity and medical claim expenses. The Subaru Outback, Mazda CX-5, and Honda Accord consistently earn top marks and benefit from favorable insurance pricing.
Advanced driver assistance systems (ADAS) reduce accident frequency before crashes occur. Automatic emergency braking, lane-departure warning, and blind-spot monitoring prevent collisions entirely. Insurers offer discounts ranging from 5-15% for vehicles equipped with these technologies, though specific discount amounts vary by company and state.
Poor safety ratings carry tangible financial penalties. Small cars lacking side airbags, vehicles with weak roof strength, or models performing poorly in small-overlap crash tests face higher premiums. The safety rating impact becomes most pronounced for liability coverage, where insurers pay medical bills and property damage for other parties.
Vehicle Value and Depreciation
Replacement value determines collision and comprehensive coverage costs. A $60,000 vehicle requires higher coverage limits than a $25,000 car, producing proportionally higher premiums. However, the relationship isn't perfectly linear—expensive vehicles often cost more per dollar of value because of compounding factors like repair complexity and theft probability.
Depreciation works in your favor over time. A three-year-old luxury sedan worth $35,000 costs significantly less to insure than when new at $55,000, even though repair costs remain elevated. Reduced replacement value lowers collision and comprehensive premiums, though liability costs stay relatively stable.
Electric vehicles experience unique depreciation patterns. Early EVs depreciated rapidly because of battery degradation concerns and limited range. Newer models with improved battery technology retain value better, but repair cost factors for electric vehicles remain higher than gas equivalents, offsetting some depreciation benefits.
Vehicle Type Insurance Cost Comparison: Key Risk Factors
| Vehicle Category | Average Annual Premium | Theft Risk Rating | Typical Repair Cost | Safety Score Impact |
| Sports Car | $2,800–$4,200 | High | $4,500–$7,000 | Moderate |
| Luxury Sedan | $2,200–$3,400 | High | $4,000–$6,500 | High |
| Standard Sedan | $1,400–$1,900 | Low | $2,500–$3,500 | High |
| Compact SUV | $1,500–$2,100 | Moderate | $3,000–$4,200 | Very High |
| Full-Size SUV | $1,800–$2,600 | Moderate | $3,500–$5,000 | High |
| Pickup Truck | $1,600–$2,400 | Very High | $3,200–$4,800 | Moderate |
Note: Premiums represent national averages for 35-year-old drivers with clean records and full coverage. Your actual rates depend on location, driving history, and chosen insurer.
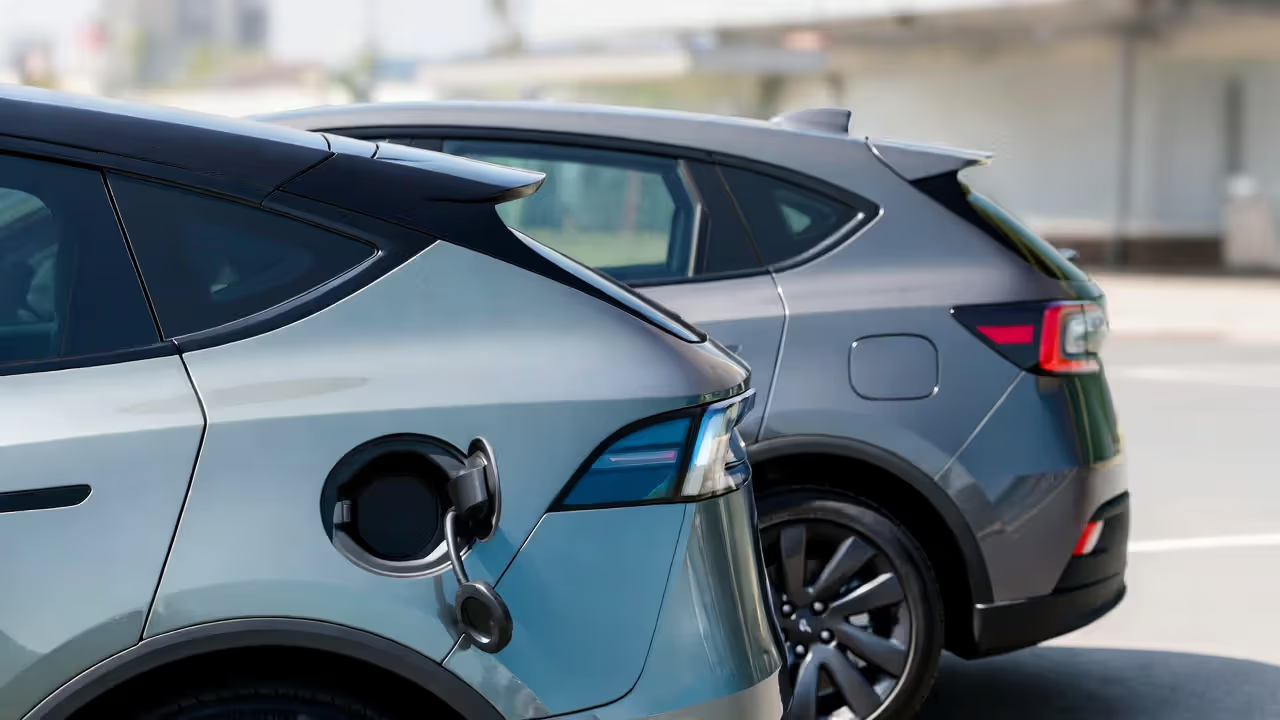
Electric and Hybrid Vehicles: Special Pricing Considerations
Electric vehicles create unique challenges for insurance pricing. Early adopters often paid 15-25% premiums over gas-powered equivalents, though that gap has narrowed as insurers accumulate claims data and repair infrastructure expands.
Author: Tara Livingston;
Source: trialstribulations.net
Battery replacement costs dominate EV repair expenses. A damaged battery pack can cost $10,000-$20,000 to replace, frequently totaling vehicles that would otherwise be economically repairable. Even minor collisions require battery inspections and potential replacement if structural integrity becomes questionable. These elevated repair cost factors keep EV premiums above their gas-powered counterparts.
Specialized repair facilities limit competition and inflate costs. Not every body shop can work on Teslas or other EVs safely and correctly. Fewer qualified repair centers mean extended wait times, higher labor rates, and increased rental car expenses. As EV adoption accelerates and more shops gain certification, this premium gap should contract.
Some insurers offer EV-specific discounts recognizing lower accident frequency. Tesla's Autopilot and similar advanced driver assistance systems reduce collision rates. Drivers selecting EVs also tend toward cautious and safety-conscious behavior. These factors partially offset elevated repair expenses.
Hybrid vehicles occupy middle territory. Repair costs exceed conventional gas vehicles because of dual powertrains, but they avoid extreme battery replacement expenses plaguing pure EVs. Most hybrids cost 5-10% more to insure than equivalent gas models—noticeable but manageable.
How to Lower Your Rate Regardless of Vehicle Type
Even if you own a vehicle category that typically commands higher premiums, several strategies reduce your insurance expenses:
Shop before you buy. Request actual insurance quotes for vehicles you're considering before finalizing any purchase decision. The premium difference between two similar models might surprise you—a Subaru WRX costs substantially more to insure than a Subaru Impreza despite sharing platforms. Getting quotes during the shopping phase lets you factor true ownership costs into your decision.
Author: Tara Livingston;
Source: trialstribulations.net
Maximize available discounts. Anti-theft devices like GPS tracking, alarm systems, and steering wheel locks qualify for discounts at most insurers. If your vehicle lacks these features from the factory, aftermarket installations cost $200-$600 but can reduce comprehensive coverage 5-15% annually.
Consider usage-based insurance programs. Telematics devices or smartphone apps monitor your driving behavior—acceleration, braking, cornering, and total mileage. Safe drivers can save 15-30% regardless of vehicle type. This option works particularly well for sports car owners who drive cautiously despite owning performance vehicles.
Adjust coverage as your vehicle ages. Once your car's market value drops below $3,000-$4,000, evaluate whether collision and comprehensive coverage make financial sense. You might be paying premiums approaching or exceeding the vehicle's value, making self-insurance more economical. This strategy works best for reliable vehicles unlikely to require major repairs.
Bundle policies for multi-vehicle discounts. Insuring multiple vehicles with one company typically saves 10-25% on each vehicle. If you own both a sports car and a practical daily driver, keeping both policies with the same insurer maximizes savings.
Increase deductibles strategically. Raising your collision and comprehensive deductibles from $500 to $1,000 typically reduces premiums 15-20%. For vehicles you can afford to repair from savings, higher deductibles make financial sense. Just maintain an emergency fund covering your deductible to avoid financial strain after accidents.
Take advantage of low-mileage discounts. If you drive fewer than 7,500 miles annually, inquire about low-mileage rates. Reduced road exposure justifies lower premiums. Some insurers offer pay-per-mile programs where you pay a base rate plus per-mile charges, ideal for weekend sports cars or secondary vehicles.
Frequently Asked Questions About Vehicle Type and Insurance Costs
Insurance premiums represent a significant ownership expense that many buyers overlook until after they've signed the purchase agreement. The quote impact of vehicle type can add thousands of dollars annually, transforming a seemingly affordable car payment into a budget-stretching commitment once insurance costs enter the equation.
Before committing to any vehicle purchase, request actual insurance quotes—not estimates from online calculators, but real quotes from multiple insurers based on the specific vehicle you plan to buy. The premium difference between two similar models might be negligible, or it might be substantial enough to redirect your entire search.
Remember that the lowest purchase price doesn't guarantee the lowest total ownership cost. A used sports car selling for $15,000 might seem like a bargain until you discover it requires $3,500 annually for insurance, while a $20,000 sedan costs only $1,400. Over five years of ownership, the sedan costs $10,500 less in insurance alone, completely offsetting its higher purchase price.
Your vehicle choice impacts your finances for the entire ownership period. Investing a few hours researching insurance costs and comparing quotes saves thousands over your ownership experience. The best vehicle for your situation balances purchase price, insurance expenses, fuel economy, maintenance costs, and personal preferences. Understanding how insurers evaluate different vehicle types gives you the information needed to make purchasing decisions that satisfy both your driving preferences and your budget constraints.